Force-directed graph layout *
Graphs are incredibly useful structures in the field of computer science and mathematics, often employed to represent relational data, such as social networks, the internet, and more. A crucial aspect of using graphs effectively is the ability to visualize them. A good graph drawing should ideally minimize edge crossings, distribute nodes evenly, and reflect symmetries, among other criteria. One popular method to achieve this is through force-directed algorithms.
The idea behind these algorithms is to treat the graph as a physical system, where nodes repel each other like particles with the same charge, while edges attract their endpoints, similar to springs connecting these particles. By simulating this physical system, the graph settles into a state of minimal energy, resulting in a visually pleasing arrangement.
The Fruchterman & Reingold algorithm https://citeseer.ist.psu.edu/viewdoc/download;jsessionid=19A8857540E8C9C26397650BBACD5311?\(doi=10.1.1.13.8444&rep=rep1&type=pdf\) is a renowned force-directed graph drawing algorithm. It models the forces in the following manner:
- Repulsive Forces: Every pair of nodes repels each other, simulating the effect of like charges. This force ensures nodes are not too close to one another.
- Attractive Forces: Nodes connected by an edge attract each other, akin to a spring's behavior. This force ensures connected nodes remain close.
The algorithm initializes node positions randomly and then refines these positions iteratively based on the combined forces acting upon them. Over time, the magnitude of these adjustments (often termed "temperature") decreases, causing the system to "cool down" and stabilize. The Fruchterman & Reingold algorithm is given in Algorithm 1.
Implementation guidelines
- Running the program:
- The program can be ran in different modes (sequential, parallel and distributed) by specifying a parameter.
- User can specify the parameters: window size (height, width of the visualization), C, |V| and E (graph size).
- The program measures run-time needed the average time needed to compute one iteration of the algorithm.
- Implementation details
- Graph libraries are off-limits.
- Given program parameters |V| and E generate a random graph.
- Implement a way to visualize the graph.
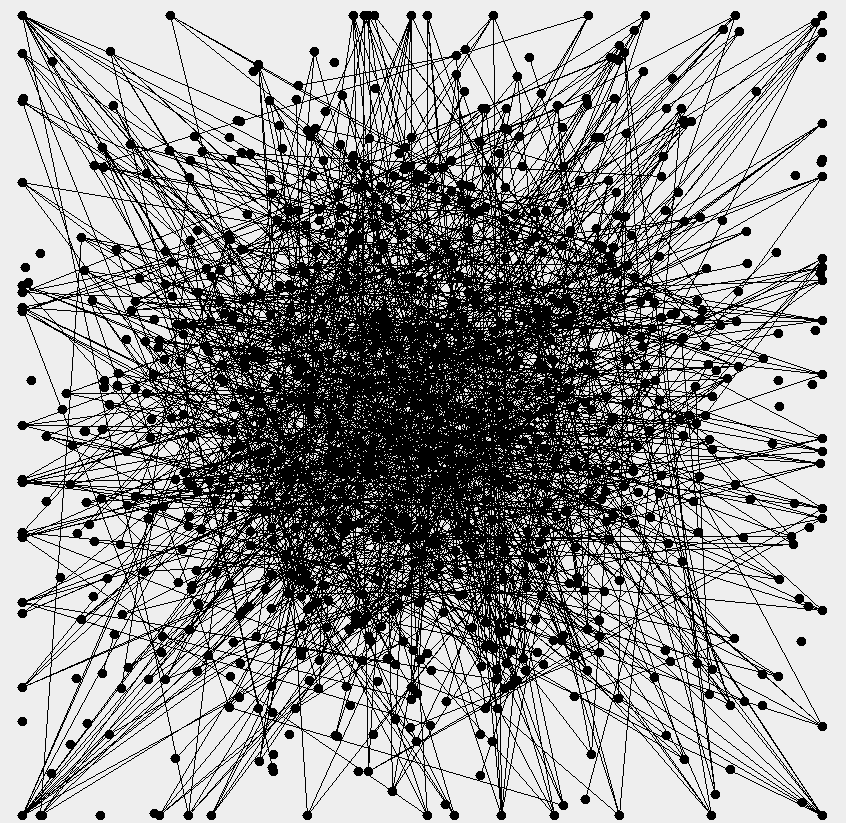
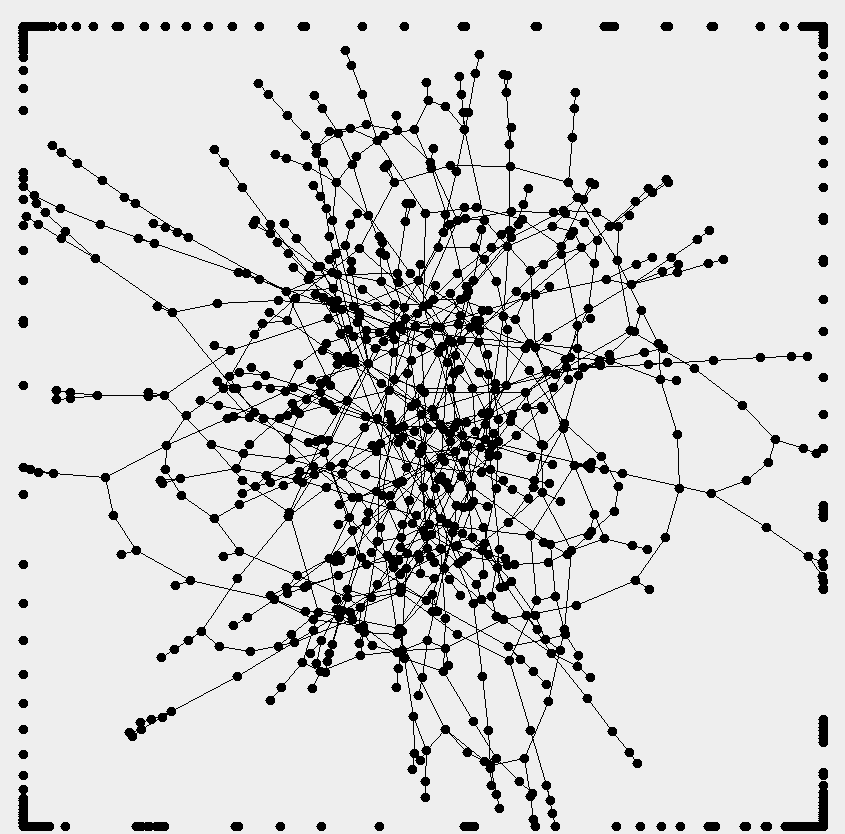
- Your solution should effectively showcase the transformation of a graph with 1,000 nodes and 1,000 edges from its initial chaotic arrangement to a clearer, minimal energy layout.
- The implementation must adapt automatically to the hardware it is being ran on (Physical CPU's, Cores, Memory, etc..).
- Wherever randomness is used a seed must be provided in order to compare solutions.
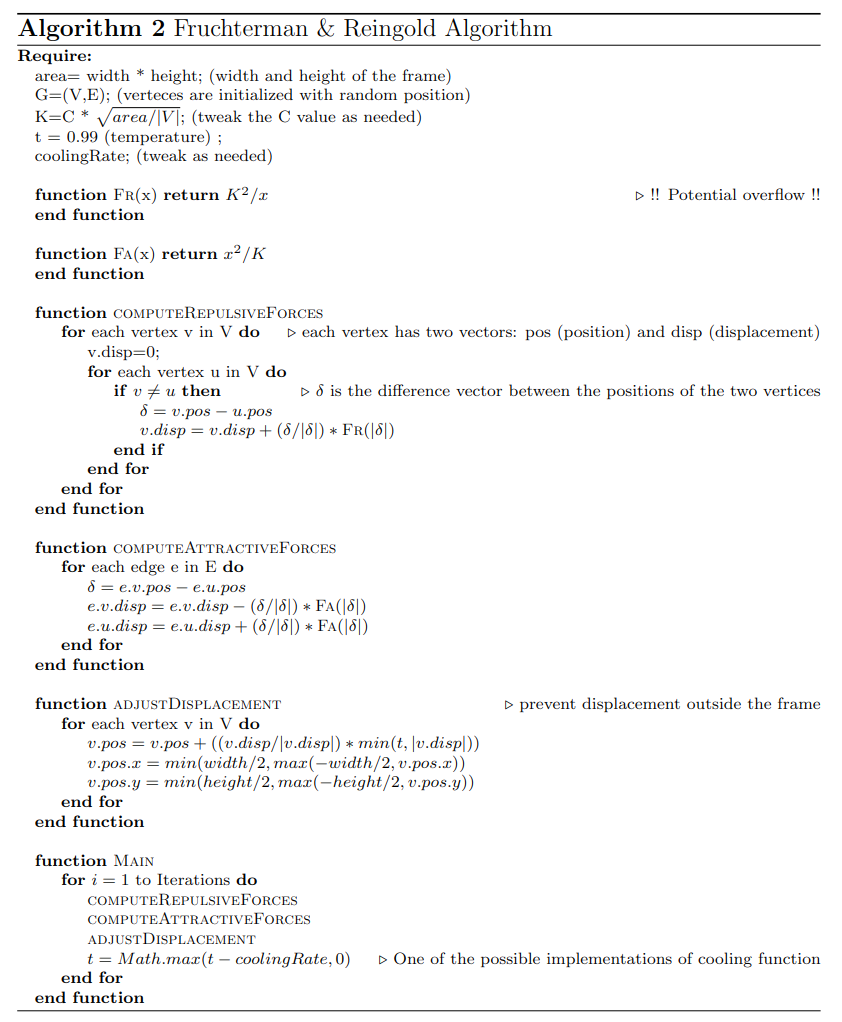
Fruchterman & Reingold Algorithm
Require:
 area = width * height; (width and height of the frame)
 G = (V, E); (vertices are initialized with random position)
 K = C * sqrt(area / |V|); (tweak the C value as needed)
 t = 0.99 (temperature);
 coolingRate; (tweak as needed)

function FR(x) return K^2 / x  ▷ !! Potential overflow !!
end function

function FA(x) return x^2 / K
end function

function COMPUTEREPULSIVEFORCES
 for each vertex v in V do  ▷ each vertex has two vectors: pos (position) and disp (displacement)
  v.disp = 0;
  for each vertex u in V do
   if u != v then
    δ = v.pos - u.pos  ▷ δ is the difference vector between the positions of the two vertices
    v.disp = v.disp + (δ / |δ|) * FR(|δ|)
   end if
  end for
 end for
end function

function COMPUTEATTRACTIVEFORCES
 for each edge e in E do
  δ = e.v.pos - e.u.pos
  e.v.disp = e.v.disp - (δ / |δ|) * FA(|δ|)
  e.u.disp = e.u.disp + (δ / |δ|) * FA(|δ|)
 end for
end function

function ADJUSTDISPLACEMENT  ▷ prevent displacement outside the frame
 for each vertex v in V do
  v.pos = v.pos + ((v.disp / |v.disp|) * min(t, |v.disp|))
  v.pos.x = min(width/2, max(-width/2, v.pos.x))
  v.pos.y = min(height/2, max(-height/2, v.pos.y))
 end for
end function

function MAIN
 for i = 1 to Iterations do
  COMPUTEREPULSIVEFORCES
  COMPUTEATTRACTIVEFORCES
  ADJUSTDISPLACEMENT
  t = Math.max(t * coolingRate, 0)  ▷ One of the possible implementations of cooling function
 end for
end function