Heat Simulation
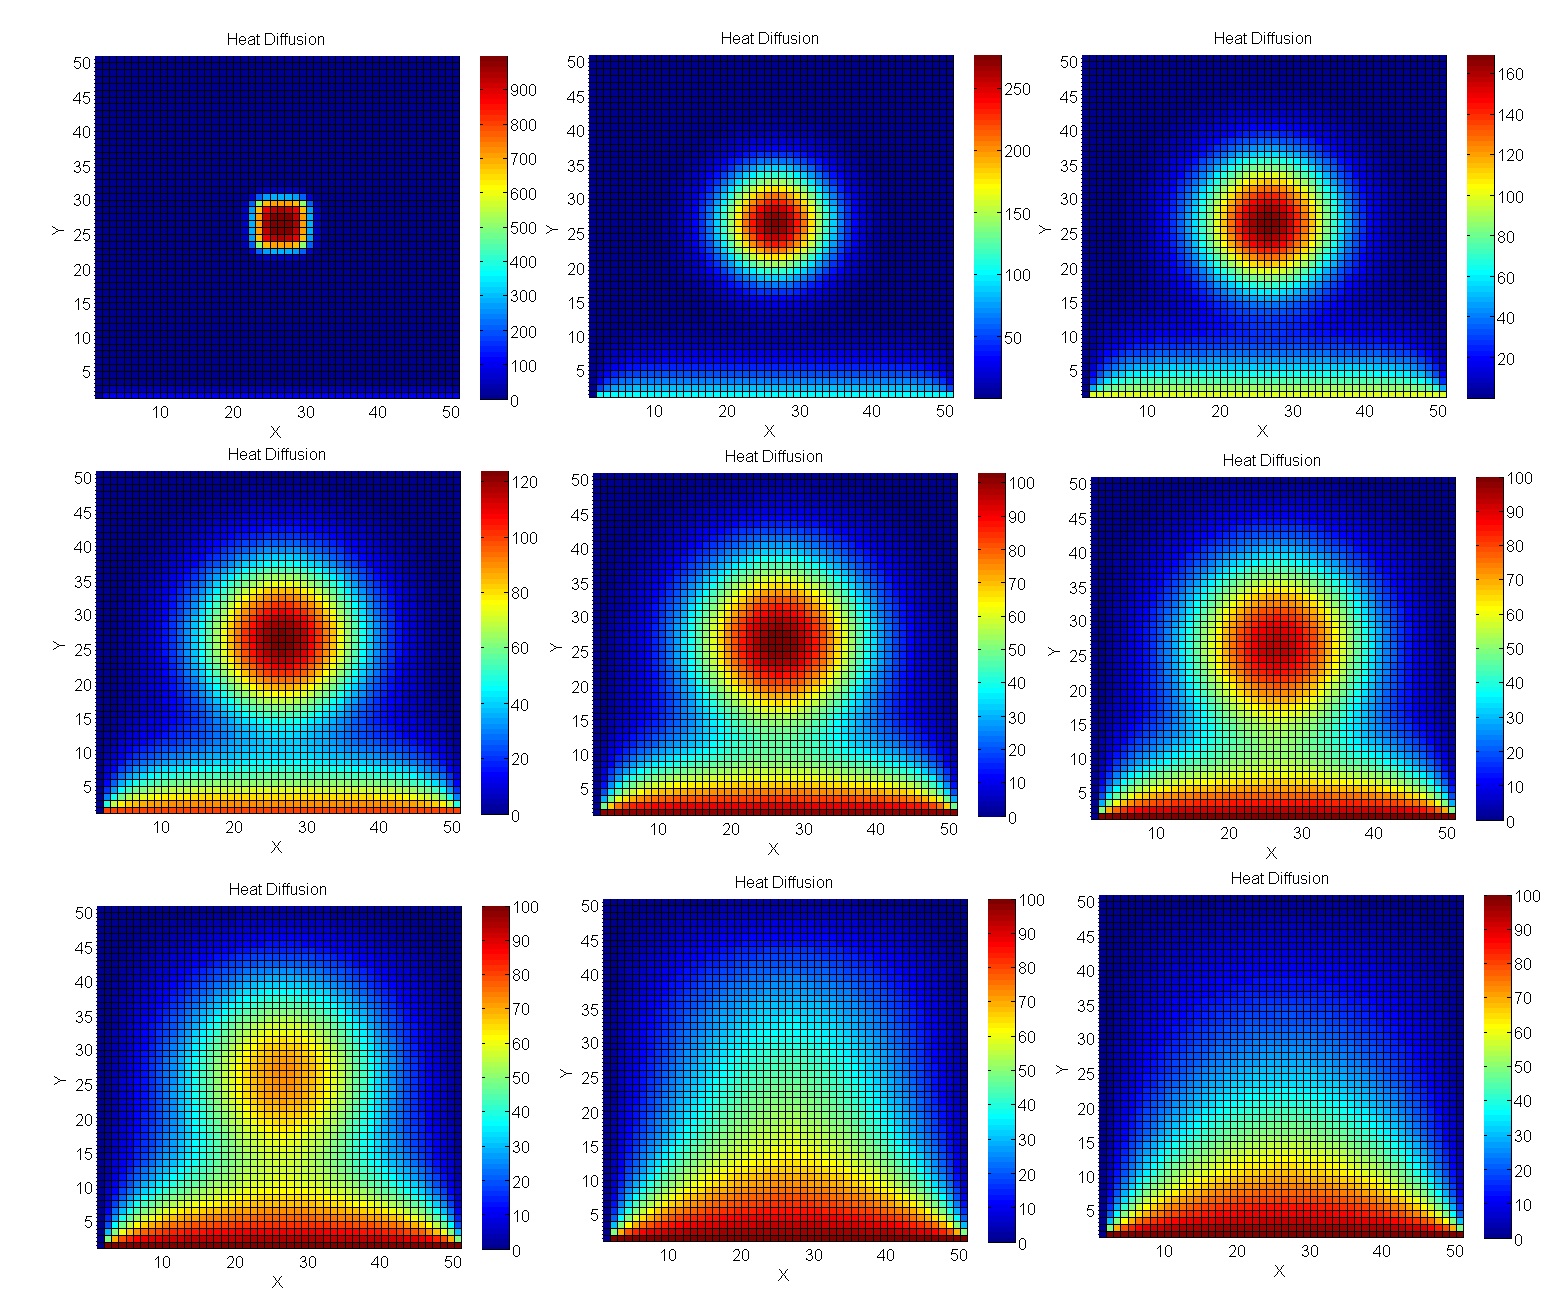
Temperature distribution is a difficult problem to simulate. However, the problem can be simplified by reducing the material to two dimensions. Imagine a metal plate with some width W, and height H. We assume the plate to be one atom thick. This reduces the heat exchange between atoms into two dimensions. The simulation is discrete and models the plate as a two-dimensional grid G in which every element is an atom. To represent the constant temperature transfer from the environment, the sides of the plate should have a fixed temperature of 0°C. We can then apply a fixed temperature to an arbitrary place in the grid, which is also assumed to be constant. To simulate the heat dispersion, we simplify the heat transfer formula so that the temperature of a grid element is: \(G_{i,j} = \frac{G_{i,j+1} + G_{i+1,j} + G_{i,j-1} + G_{i-1,j}}{4}\)
Implementation guidelines
- Implementation of the graphical interface:
- The program should have parameters with which the graphical interface can be toggled to achieve best performance.
- The drawing of the graphics should be done independently of the computational threads.
- The default size of the window is 800x600px but can be adjusted manually.
- Running the program:
- The simulation is defined by providing the following input parameters: Width W, Height H, and Number of random points N, which generate a constant temperature of 100°C.
- The simulation stops once no tile, has changed it's temperature for more than 0.25°C and we assume the simulation has reached a stable state.
- The program measures run-time needed to complete.
- Problem specific implementation requirements
- User has the option to click and heat up that point.
- Use a color gradient to draw the temperature interval so that high temperatures are red, and low temperatures are blue.
- The graphical user interface should update "on the fly" drawing the state of the simulation.
- The graphical interface is not needed for the MPI implementation.
- All three implementations must simulate the same configuration. Use a seeded random number generator to ensure all three implementations have the same heat sources to guarantee comparability between run times.
Testing
The report must include extensive testing and explanation of results (numeric and graphical). All three versions must be tested. The tests should be performed without drawing graphics. The parameters that influence the runtime are the number of heat sources, and the dimensions of the grid. Consequently, both need to be tested independently to show how the implementation scales. Present the results with informative charts/figures and explain them in detail. The implementation should be tested in the following way:
- Testing by limiting the grid size Limit grid dimensions to 1024x1024 (or any other number you think is best). Set the number of heat sources to 10. Run the algorithm multiple times by increasing the number of accumulation sites by 10 until the algorithm takes too long to complete (reasonable amount of time should be in minutes) or the number of heat sources reaches 1024. Every configuration should be ran at least three times, the average runtime should be considered when analyzing results.
- Testing by limiting the number of heat sources Set a number of heat sources to 1024. Begin simulating a grid size of \(1024 \times 1024\). Run multiple simulations by increasing the grid size by 1024 in both dimensions until the simulation takes too long to complete (reasonable amount of time should be in minutes). Every configuration should be ran at least three times, the average runtime should be considered when analyzing results.