K-means Clustering
K-means clustering is one of the basic algorithms for clustering. In this project you will solve a clustering algorithm using GPS coordinates of locations in Europe. Each location includes a capacity. The locations and capacities are garbage collection facilities. Their capacity is the annual amount of waste accumulated in tonnes. The result of the k-means clustering will be a sub-optimal placement of k facilities that process the accumulated waste. The optimization minimizes the distance between accumulation sites and processing plants. The problem must be generalized to provide such that it solves an arbitrary amount of facilities. More details are given in the implementation guidelines. Also, refer to https://en.wikipedia.org/wiki/K-means_clustering for details about k-means clustering.
Implementation guidelines
- Implementation of the graphical interface:
- The program should have parameters with which the graphical interface can be toggled to achieve best performance.
- The drawing of the graphics should be done independently of the computational threads.
- The default size of the window is 800x600px but can be adjusted manually.
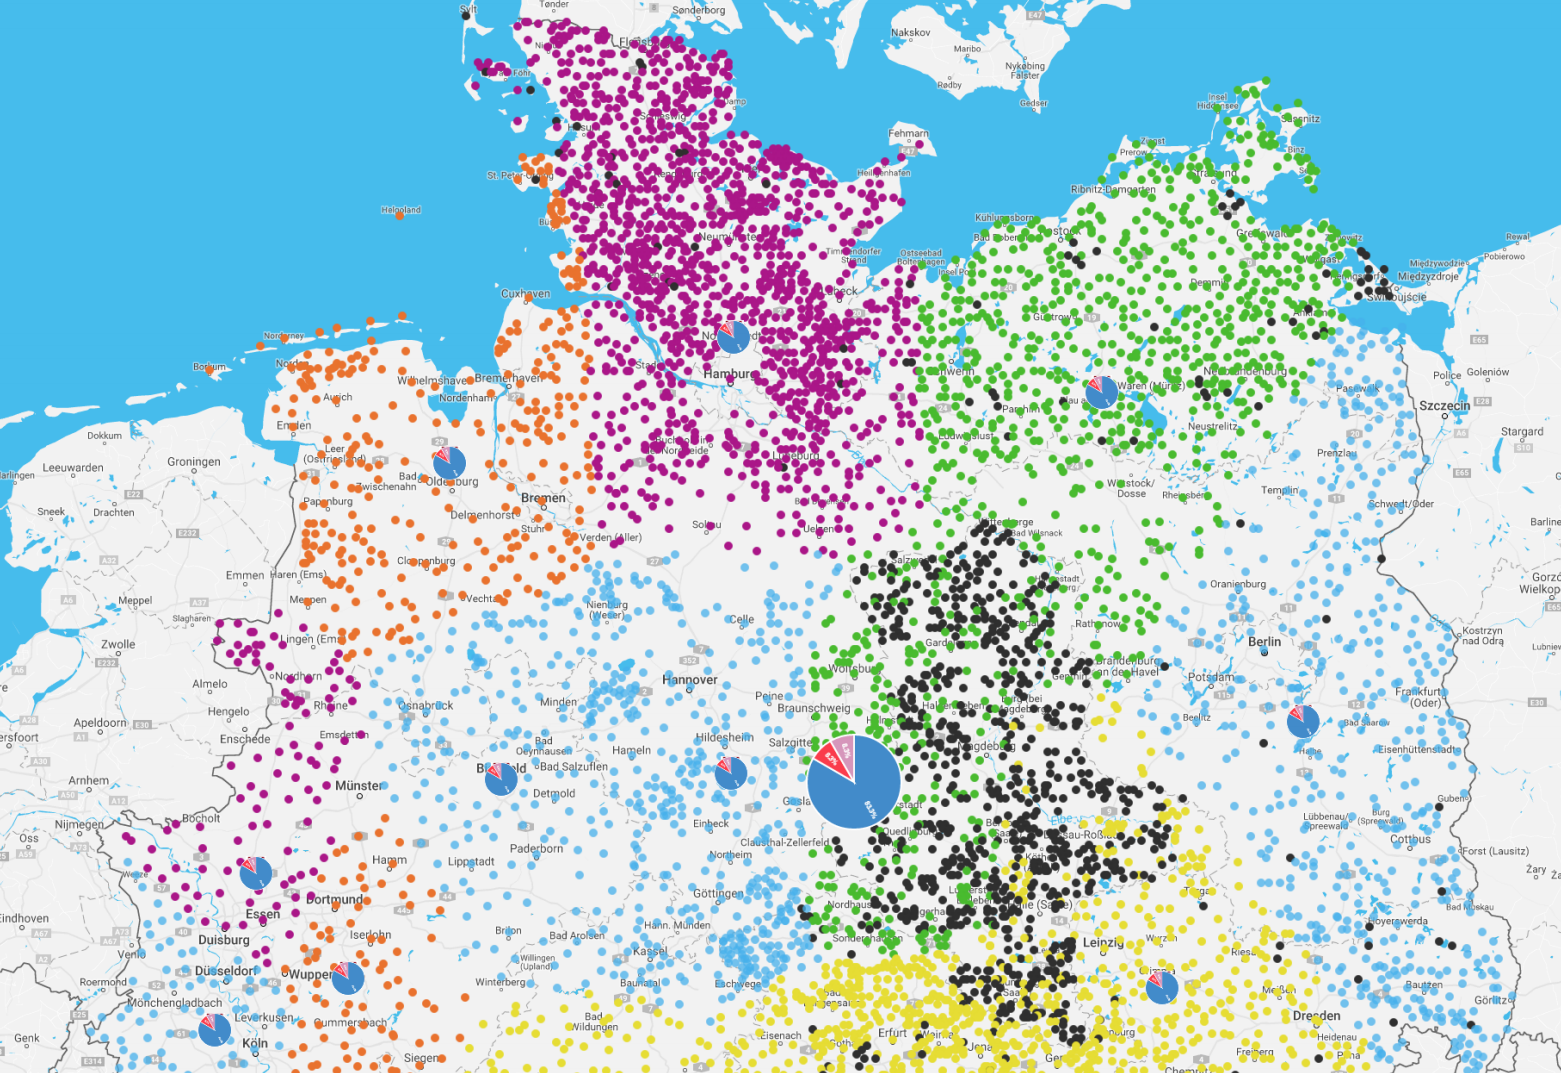
- The graphical interface must use a library to display maps (i.e. openstreetmaps).
- The graphical interface can scale, zoom and move. Initially, it scales to fit all points in the view-port.
- Running the program:
- The program can be ran in different modes (sequential, parallel, distributed) by specifying a parameter.
- User can specify the number of accumulation sites and the number of clusters.
- The program measures run-time needed to complete.
- Problem specific implementation requirements
- Every version (sequential, parallel, and distributed) measures cycles passed. Every update of positions of all particles is considered a cycle. All three implementations run the simulation until they reach a specified number of cycles.
- In case the number of sites is greater then the provided dataset, their positions and capacities must be chosen at random. Capacities should have an upper bound equal to the sample dataset. The positions must be in Europe and even though the equidistant distance can be used.
- The implementation must adapt automatically to the hardware it is being ran on (Physical CPU's, Cores, Memory, etc..).
Testing
The report must include extensive testing and explanation of results (numeric and graphical). All three versions must be tested. The tests should be performed without drawing graphics. The parameters that influence the runtime are the number of accumulation sites and number of clusters. Consequently, both need to be tested independently to show how the implementation scales. Present the results with informative charts/figures and explain them in detail. The implementation should be tested in the following way:
- Testing by limiting the number of clusters Limit the number of clusters to 20 (or any other number you think is best). Set the number of accumulation sites to 500. Run the algorithm multiple times by increasing the number of accumulation sites by 500 until the algorithm takes too long to complete (reasonable amount of time should be in minutes). Every configuration should be ran at least three times, the average runtime should be considered when analyzing results.
- Testing by limiting the number of accumulation sites Set the number of accumulation sites to 30,000 and the number of clusters to 5. For every new configuration, increase the number of clusters by 5 until the computation run-time is within few minutes or the number of clusters reaches a third of the number of accumulation sites. Every configuration should be tested at least three times with their average considered as the result.
Supporting material
The suppoting data can be downloaded from HERE
The dataset is a zip-compressed JSON formatted list of waste wood accumulation sites. Each site is of the following structure:
{"name":"Ruhland","capacity":75.25194920635,"la":51.4667,"lo":13.8667},
{"name":"Tettau","capacity":44.38621959541,"la":51.4333,"lo":13.7333},
{"name":"Guteborn","capacity":11.0917739618,"la":51.4167,"lo":13.9333}
Properties "la" and "lo" denote the latitude and longitutde of the location. The capacity is in tonnes of waste wood accumulated anually.