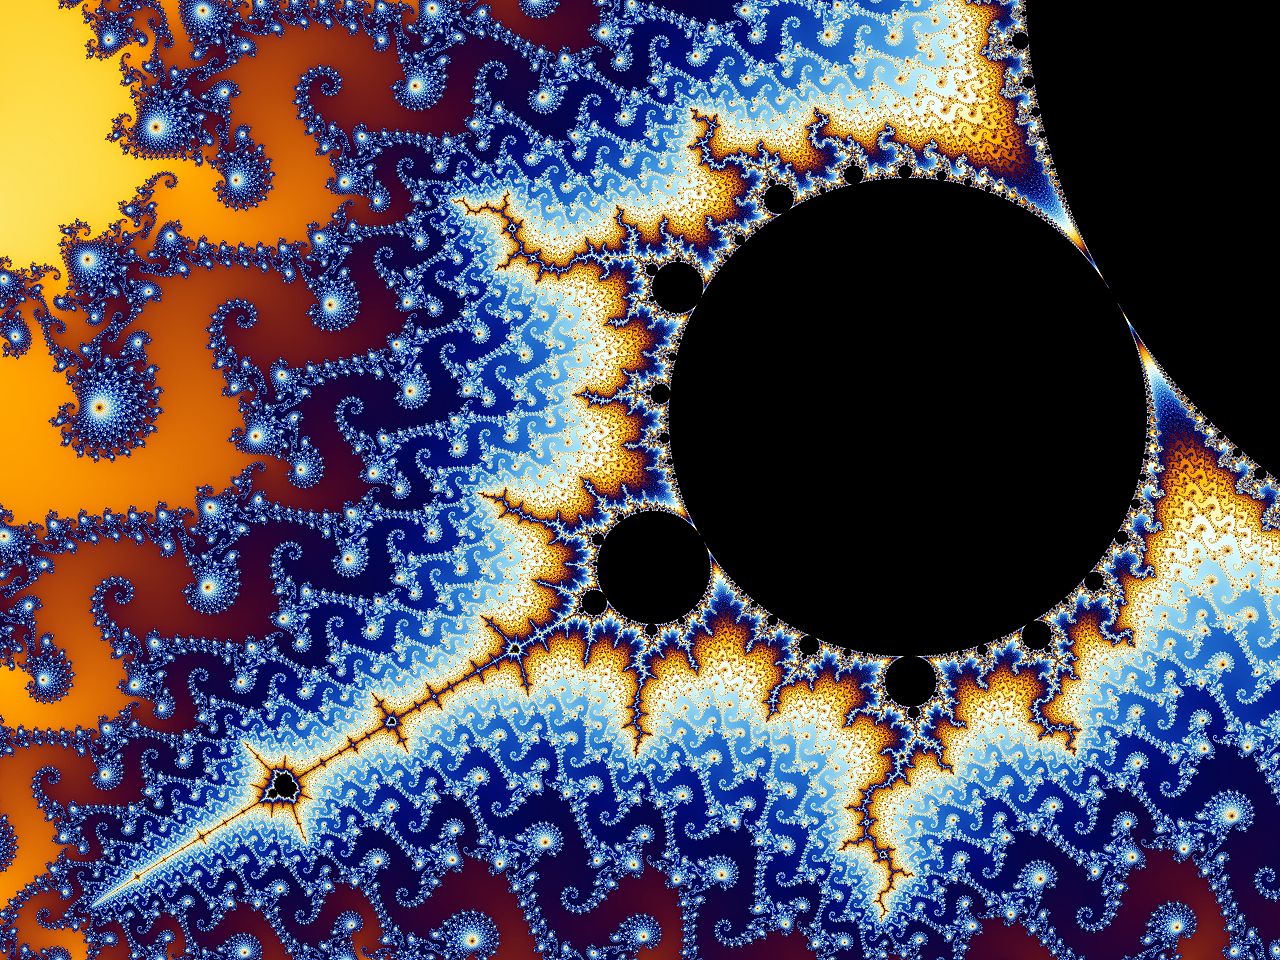
Mandelbrot Set

A Mandelbrot set is a set of points from a set complex numbers. By drawing the points we obtain infinite fractals that form interesting eye catching images. The usual implementation is based on the visualization. To graphically represent a Mandelbrot set, use the escape-time algorithm that computes the color of a pixel and draws it.
Implementation guidelines
- Implementation of the graphical interface:
- The program should have parameters with which the graphical interface can be toggled to achieve best performance.
- The drawing of the graphics should be done independently of the computational threads.
- The default size of the window is 800x600px but can be resized on runtime.
- The drawing of frames should be limited to 60 frames per second (FPS).
- The interface should enable zooming in and out, which redraws the Mandelbrot set with more/less detail with mouse scroll.
- The interface should enable moving (directional keys or preferably mouse drag) in all directions, which redraws the Mandelbrot set to fit the view-port.
- Running the program:
- User can specify the size of the resulting image.
- The resulting image is saved to disk as a PNG or JPEG file.
- The program measures run-time needed to complete.
- Problem specific implementation requirements
- The implementation must adapt automatically to the hardware it is being ran on (Physical CPU's, Cores, Memory, etc..).
Testing
The report must include extensive testing and an explanation of the results (numeric and graphical). All three versions must be tested. The tests should be performed without drawing graphics. The parameters that influence the run time are the width and height of the resulting image representation. Test multiple configurations by starting with an image of 1000x1000 and increase both width and height by 1000 to obtain the next configuration. Test all three implementations on the same configurations and present the results. The submitted project should include a raw text file in CSV format containing the results of the testing. The fields should be: (width, height, sequential, parallel, distributed). In your report, present the results in numerical form and graphical representation (charts). Discuss the results and explain discrepancies if any.
